


 27 / 166


C&M INDUSTRY ECONOMIC INDICATORS
Communications and Multimedia Industry
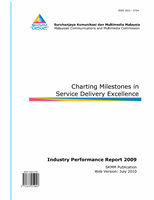
Amidst the less buoyant global economic situation in 2009, the communications and
multimedia industry in Malaysia was less adversely affected by the
the region.
The industry has proved to be relatively resilient, albeit a moderated growth across
all the telecommunications, broadcasting and postal sectors. Inclusive in this revenue are the
companies listed on the Access, C
the MESDAQ market) and the digital signature market.
In 2009, the aggregated domestic revenue of the communications and multime
comprising public listed telecommunications, broadcast
companies was RM32.2 billion. This is a growth of 2% from RM31.5 billion in 2008.
Source: Industry, SKMM
Fig.3.8 C&M Industry Revenue Growth: Overseas versus Domestic
Source: Industry, SKMM
Fig. 3.9 Percentage Contribution to Revenue of
6
Effective 3 August 2009
20.6
23.6
1.3
1.5
18
20
22
24
26
28
30
32
34
36
38
40
42
44
46
2003
2004
RM (billion)
C&M Industry Revenue Growth: Overseas versus Domestic
+ 63% Overseas
+ 19% Domestic
+ 15% Overseas
+ 14% Domestic
+ 592% Overseas
+ 56% Domestic
96%
94%
4%
6%
10%
20%
30%
40%
50%
60%
70%
80%
90%
100%
2002
2003
Percentage Contribution to Revenue of Communications and
Multimedia Industry: Domestic versus Overseas
– C&M REVENUE TREND
– 6.2% of GDP
crisis than other countries in
ertainty and Efficiency (ACE) Market
6
(previously known as
ing, postal services and the smaller
Communications and Multimedia Industry: Domestic versus Overseas
25.3
27.0
30.0
31.5
2.4
5.7
7.1
9.2
2005
2006
2007
2008
Domestic
Overseas
+ 60% Overseas
+ 7% Domestic
+ 133% Overseas
+ 7% Domestic
+ 25% Overseas
+ 11% Domestic
+ 30% Overseas
+ 5% Domestic
94%
91%
83%
81%
6%
9%
17%
19%
2004
2005
2006
2007
Domestic
Overseas
27
dia industry,
32.2
9.0
2009
-2.5% Overseas
+ 2% Domestic
77%
75%
23%
25%
2008
2009